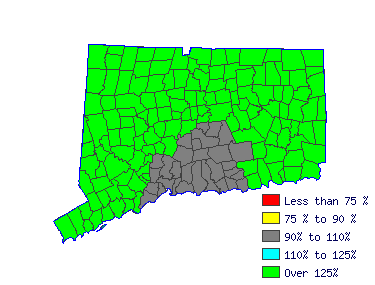
| South Central WDA (1Q 2016) |
| All Industry |
| Estimated employment | N/A |
| Mean wage | $68,434 |
| Entry wage | $28,924 |
| 10th percentile wage | $19,632 |
| 50th percentile wage | $58,512 |
| 90th percentile wage | $126,423 |
 | | Top Employing Industries |
| Industry | Employment / Percent |
| Education and Health Services | | |
 |
| Top Paying Industries |
| Industry | Employment / Median Wage |
| Education and Health Services | | $58,512 |
 | |
 |
| Business Teachers, Postsecondary (25-1011) |
| Teach courses in business administration and management, such as accounting, finance, human resources, labor relations, marketing, and operations research. Include both teachers primarily engaged in teaching and those who do a combination of both teaching and research. |
 |
| Mean Wage History |
| Year | This
Occupation | Compared to
Occupational Group | Difference |
| Current | $58511.88 | | $59532.46 |
| -$1020.58 | | 2015 | $57025.86 | +2.6% | $58020.52 |
+2.6% | -$994.66 | | 2014 | $55957.79 | +1.9% | $56933.82 |
+1.9% | -$976.03 | | 2013 | $54889.72 | +1.9% | $55847.12 |
+1.9% | -$957.40 | | 2012 | $53821.64 | +2.0% | $54760.41 |
+2.0% | -$938.77 | | 2011 | $52985.76 | +1.6% | $53909.95 |
+1.6% | -$924.19 | | 2010 | $52057.00 | +1.8% | $52964.99 |
+1.8% | -$907.99 | | 2009 | $51499.74 | +1.1% | $52398.01 |
+1.1% | -$898.27 | | 2008 | $49967.29 | +3.1% | $50838.83 |
+3.1% | -$871.54 | | 2007 | $48295.52 | +3.5% | $49137.90 |
+3.5% | -$842.38 |
| Year | This
Occupation | Compared to
All Occupations | Difference |
| Current | $58511.88 | | $43353.41 |
| $15158.47 | | 2015 | $57025.86 | +2.6% | $42140.48 |
+2.9% | $14885.38 | | 2014 | $55957.79 | +1.9% | $41239.45 |
+2.2% | $14718.34 | | 2013 | $54889.72 | +1.9% | $40407.73 |
+2.1% | $14481.98 | | 2012 | $53821.64 | +2.0% | $39714.63 |
+1.7% | $14107.01 | | 2011 | $52985.76 | +1.6% | $39090.84 |
+1.6% | $13894.91 | | 2010 | $52057.00 | +1.8% | $38432.40 |
+1.7% | $13624.60 | | 2009 | $51499.74 | +1.1% | $37912.57 |
+1.4% | $13587.17 | | 2008 | $49967.29 | +3.1% | $36942.23 |
+2.6% | $13025.05 | | 2007 | $48295.52 | +3.5% | $35763.96 |
+3.3% | $12531.56 |
 |
|
| Reference Date: 1st Quarter 2016 |
| Top Areas For This Occupation |
|
|
|

| |


